Wishbone Research · Industry Report · May 2026
The Great SaaS Compression
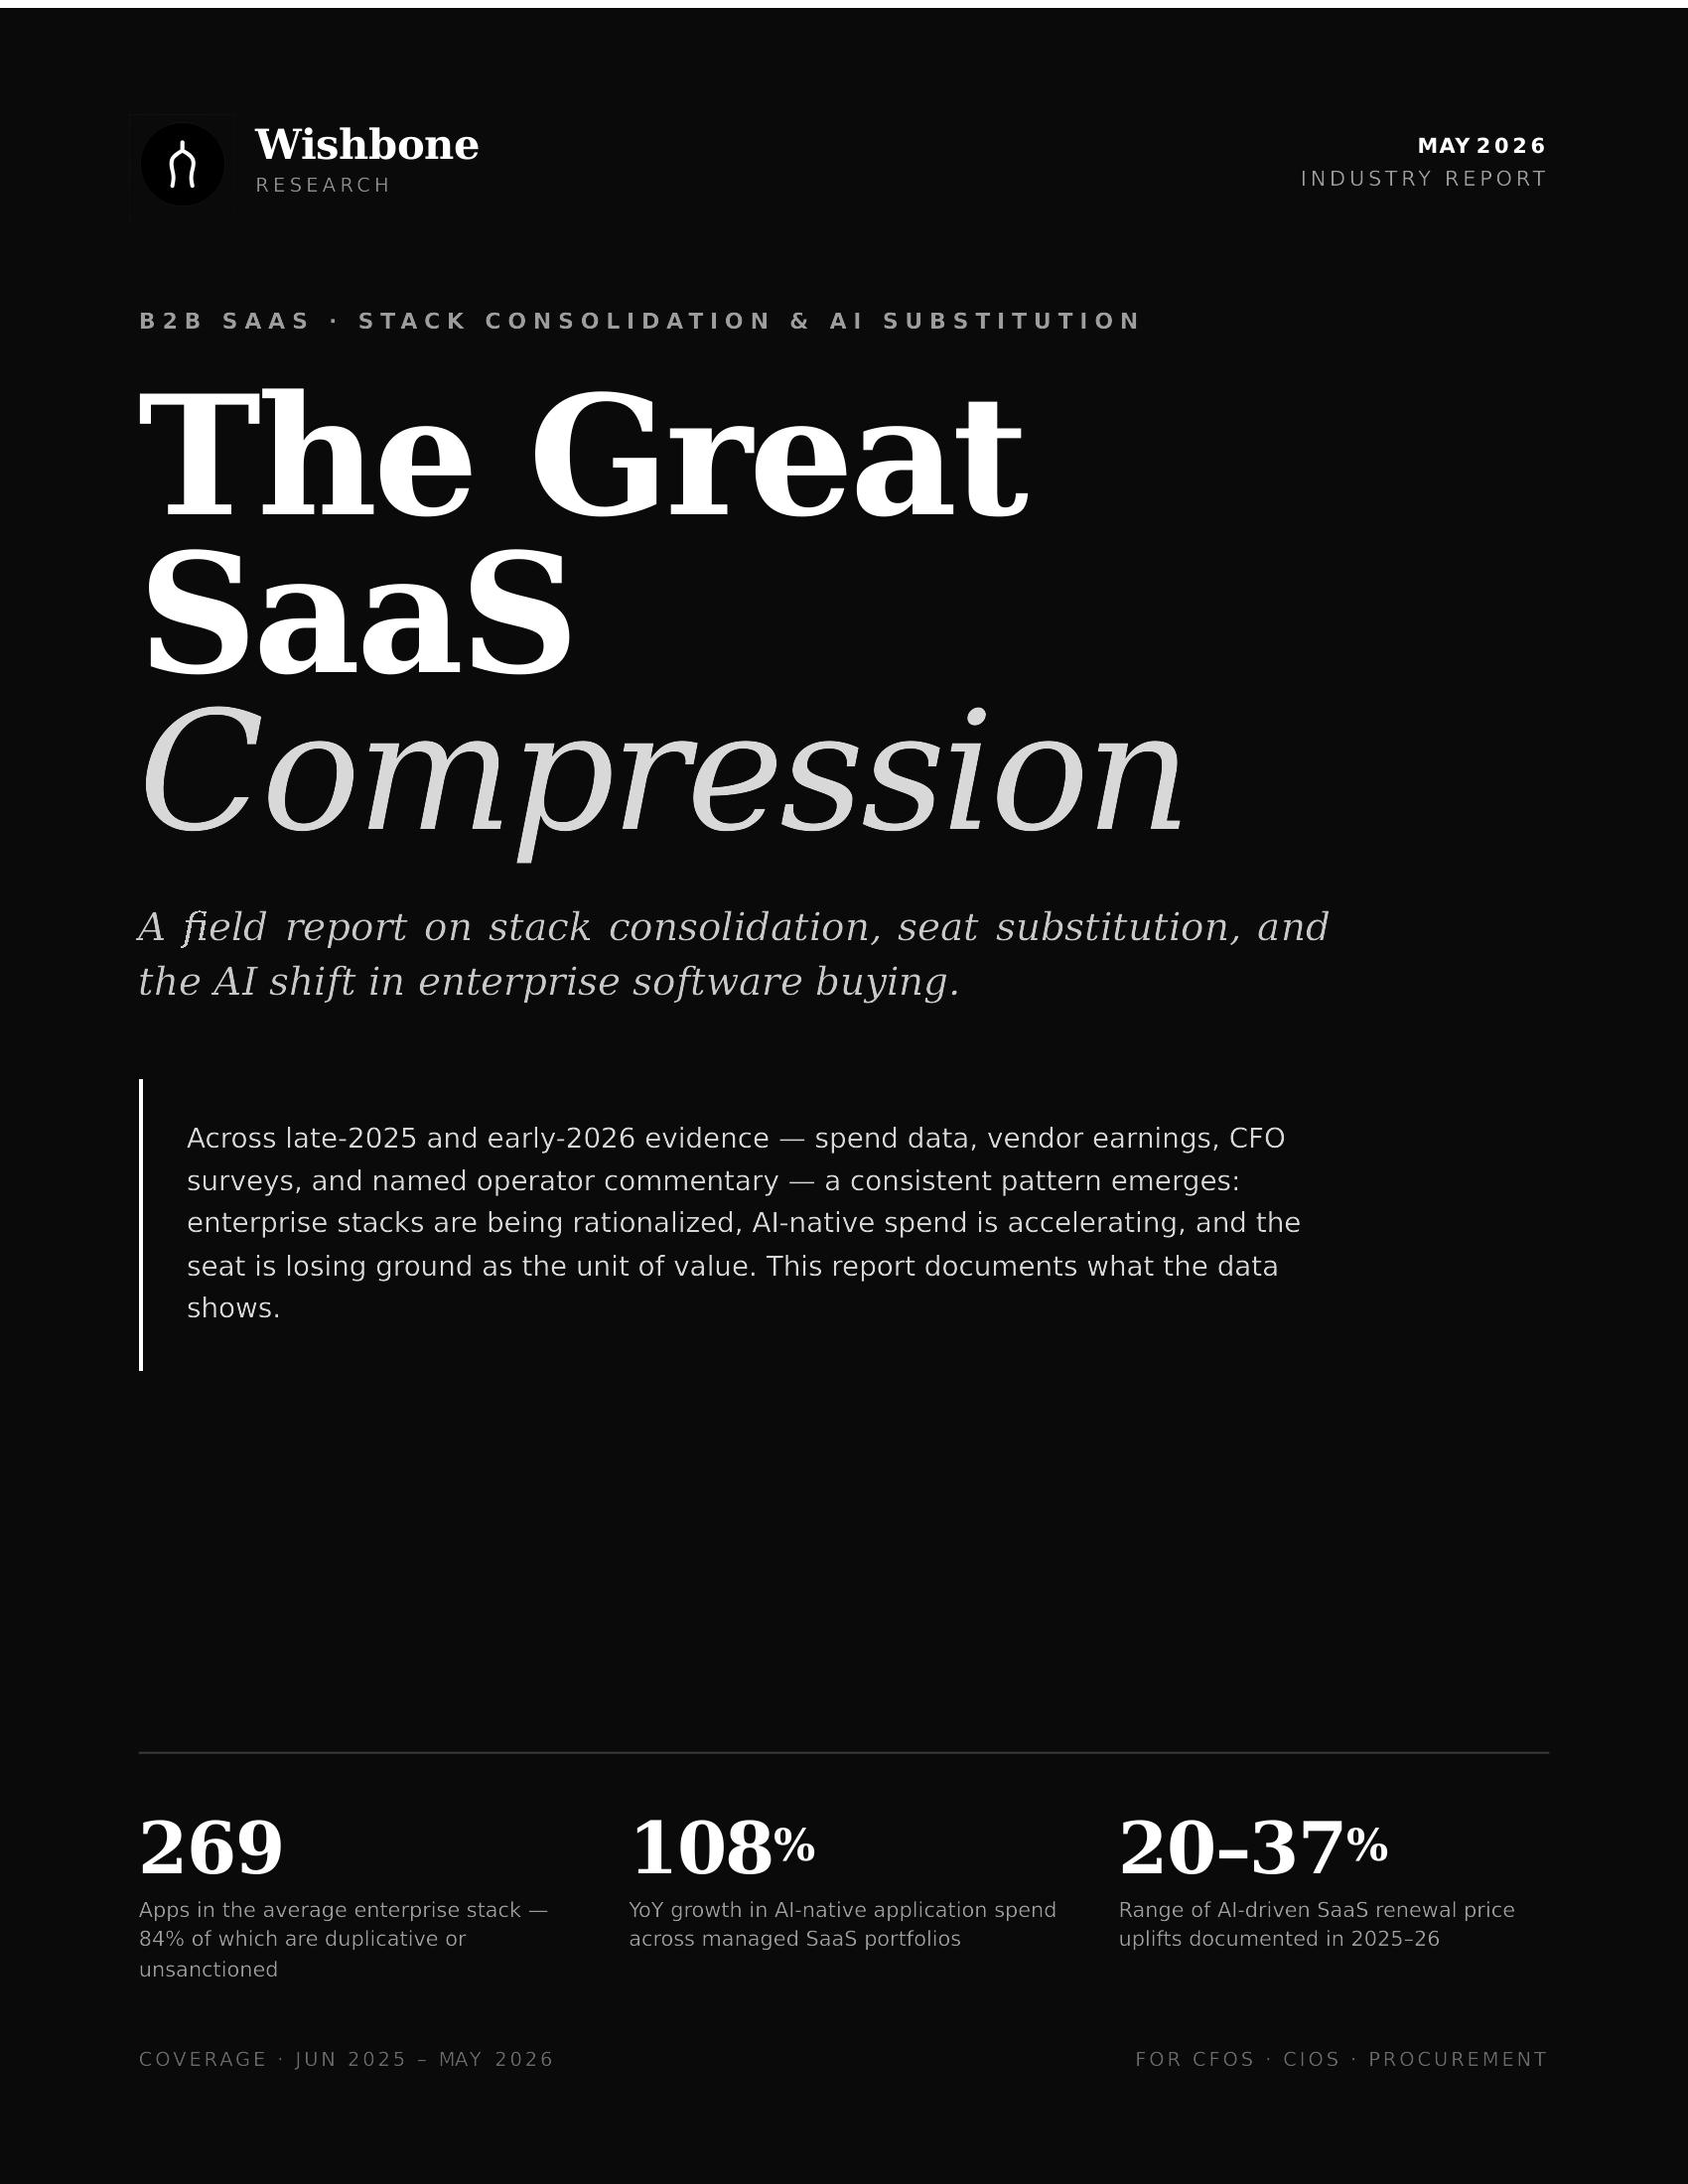
A field report on stack consolidation, seat substitution, and the AI shift in enterprise software buying — built from 30+ primary sources between June 2025 and May 2026.
Apps in the average enterprise stack — 84% duplicative or unsanctioned
YoY growth in AI-native application spend across managed SaaS portfolios
Range of AI-driven SaaS renewal price uplifts documented in 2025–26
Free download · PDF
Get the full report
8 pages · ~10 min read
What's inside
The pattern across the data
Three structural shifts compounding at once: stack rationalization, seat substitution, and renewal pressure. We document each — with named sources, dated commentary, and reconciled numbers.
- Reconciled stack-size data across BetterCloud, Productiv, Zylo, and Tropic — and what the divergence actually means
- Where the displaced budget is going: AI-native apps, consumption pricing, and the 393% spend jump at 10K+ employee enterprises
- The earnings split — per-seat compression (Dropbox, ZoomInfo, Asana, Monday) vs. consumption acceleration (Snowflake, MongoDB, Datadog, Cloudflare)
- How outcome-based pricing went from 2% to 18% adoption in two quarters
- Five observations CFOs, CIOs, and procurement leaders should pressure-test their 2026 plan against
- 30+ primary sources cited — earnings transcripts, CFO surveys, named operator commentary
"SaaS isn't dying. It's bifurcating."
— Wishbone Research, May 2026
The three shifts
A decade of seat-led growth is unwinding.
Stack rationalization
Managed app counts are flat or declining at the largest enterprises after a decade of expansion. Tropic reports a 28.8% reduction at firms with 1,500–4,999 employees.
Seat substitution
Workflows historically purchased as software for a team are being purchased as the work output itself — Intercom Fin at $0.99/resolution, Agentforce at $540M ARR up 330%.
Renewal pressure
79% of IT leaders saw price increases at renewal in the last 12 months. CFO involvement in software decisions is up ~40%. Procurement cycles +22% since 2022.
Who it's for
Built for the people doing the buying — and the people defending the budget.
CFOs
Pressure-test 2026 software assumptions against the consumption-vs-seat earnings split.
CIOs & IT leaders
Calibrate stack-size benchmarks and renewal-uplift expectations against primary data.
Procurement
Arm renewal conversations with named precedents on AI-feature bundling and outcome pricing.
SaaS operators
Understand where your category sits on the bifurcation curve before your next pricing cycle.
Get the report
Download The Great SaaS Compression
Free PDF. 8 pages. The full data set, named sources, and five observations to take into your next planning cycle.
Get the report